


Past performance is not indicative of future results. All historical data, including but not limited to returns, volatility, and other performance metrics, should not be construed as a guarantee of future performance.
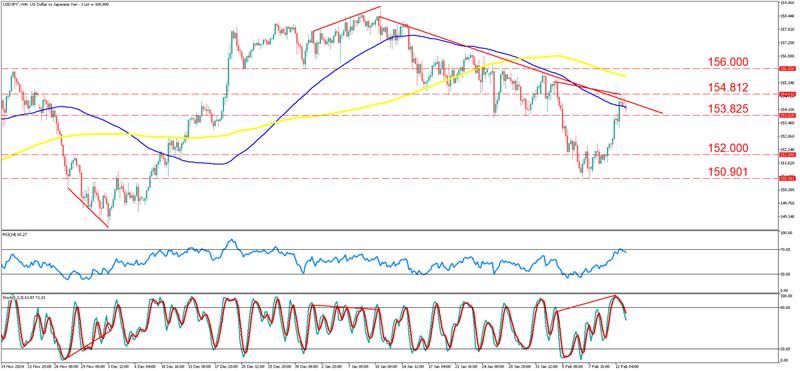
USD/JPY on a 4-hour timeframe
USD/JPY on a 4-hour timeframe has exhibited a series of technical developments, including multiple instances where the price found support at the 100-period simple moving average (SMA) in blue. Historically, the pair demonstrated an uptrend until late December before forming a bearish divergence on the RSI and Stochastic indicators, which coincided with a shift in market sentiment. This led to a downward correction, confirming a lower high formation and suggesting weakness in bullish momentum. Price eventually broke below the 100 SMA, reinforcing the selling pressure and initiating a deeper retracement.
In recent price action, USD/JPY has shown signs of recovery, bouncing from the 150.901 support level and approaching the 154.812 resistance. However, the recovery aligns with a descending trendline acting as dynamic resistance, suggesting a critical decision point. Notably, the price tested the 100 SMA multiple times before decisively breaking below it, and now it approaches the moving average from below, which may act as a resistance. The previous role of this SMA as support, followed by its recent breach, signals a potential shift in market structure.
The RSI currently hovers near 65, reflecting bullish momentum but not yet in overbought territory. Meanwhile, the Stochastic oscillator exhibits a hidden bearish divergence, where price made lower highs while the indicator formed higher highs, suggesting weakening bullish momentum. This divergence, combined with the confluence of resistance at the 100 SMA and descending trendline, raises the probability of a pullback or reversal from current levels.
The primary scenario anticipates that if the price fails to break above 154.812 and the 100 SMA with conviction, USD/JPY may resume its downtrend, targeting the 152.000 psychological level initially, followed by 150.901. A sustained break below these levels could open the door to further downside, potentially revisiting the 149.500 zone. Bearish confirmation may come from a rejection at resistance with increased selling pressure.
Alternatively, a break above 154.812 and the 100 SMA could invalidate the bearish outlook, allowing the price to test 156.000 and potentially beyond. If this breakout is supported by strong momentum and volume, it could signal the continuation of a bullish reversal, with buyers regaining control and pushing towards higher resistance levels.
Fundamentally, USD/JPY remains influenced by key macroeconomic factors, including interest rate differentials between the Federal Reserve and the Bank of Japan. With the Fed maintaining rates around 5.5% and the BoJ near 0%, the dollar remains more attractive, supporting USD/JPY. Upcoming events such as the U.S. CPI release on February 13, Fed Chair Powell’s testimony, U.S. retail sales data, Japanese GDP figures, and the BoJ policy decision will be critical. Higher-than-expected U.S. inflation could strengthen the dollar, while dovish Fed commentary may weaken it. Additionally, stronger Japanese GDP or any BoJ policy tightening signals could bolster the yen, introducing downside risks for USD/JPY. Traders should remain cautious and monitor these events for potential volatility.
Summary:
- Bearish Divergence Signals Weakness: RSI is near 65, and the Stochastic oscillator shows hidden bearish divergence, suggesting potential selling pressure.
- Key Resistance & SMA Test: USD/JPY broke below the 100 SMA, which is now acting as resistance near 154.812, aligning with a descending trendline.
- Critical Support Levels: If rejected at resistance, USD/JPY may drop towards 152.000, 150.901, or even 149.500 if bearish momentum strengthens.
- Breakout Scenario: A strong break above 154.812 and the 100 SMA could signal a bullish reversal, targeting 156.000 and beyond.
- Fundamental Risks: Upcoming U.S. CPI, Fed policy signals, BoJ decision, and Japan GDP data could drive volatility and influence USD/JPY’s next big move.